A dynamic document is a powerful way to combine text, code, and results in a single, integrated file. Unlike static reports, dynamic documents allow you to generate outputs directly from your code, such as tables, figures, and analysis summaries. This ensures that your results are always up to date, as any change in your data or analysis is reflected in the document. The output of dynamic documents can take different shapes, such as HTML, PDF, Word, or slides and can be used to create research papers, presentations, websites and even books.
Motivation and tools for dynamic documents
Dynamic documents are especially useful for longitudinal data analysis because they:
- Enhance reproducibility: By embedding code directly in the document, anyone reviewing your work can see exactly how the results were generated.
- Simplify updates: If you adjust your dataset or rerun models, the document automatically updates to reflect these changes, saving time and avoiding errors.
- Support collaboration: Dynamic documents provide a clear, transparent workflow that is easy for collaborators to follow and reproduce.
- Improve communication: By combining narrative text with visuals and tables, dynamic documents make it easier to tell the story of your analysis.
There are several tools for creating dynamic documents, with R Markdown being one of the most popular options in R. Here are some common types:
- R Markdown: A versatile tool for creating HTML, PDF, Word documents and presentations. It integrates seamlessly with R and allows you to include code chunks that produce tables, graphs, and other outputs.
- Quarto: An emerging alternative to R Markdown that supports multiple programming languages and outputs.
- Shiny: While technically not a “document,” Shiny apps provide an interactive way to present analysis results.
How to create dynamic documents in R
To create a basic R Markdown file:
- Click File > New File > R Markdown in RStudio.
- Choose the document type (e.g., HTML, PDF, or Word) and add a title.
- A template file will appear with example content. You can modify it to include the content that you want.
Dynamic documents are ideal for presenting results in a clear and engaging way. Here’s a simple workflow for writing reports:
- Start with a clear outline: Organize your report into logical sections, such as Introduction, Methods, Results, and Discussion.
- Embed code chunks for results: Dynamic documents are organized around “code chunks”. These are pieces of R code that are integrated in the document. You can decide if the code is run or not or if it will appear in the output. For example, if you work with other people that understand R code you can show how your results were generated. If, on the other hand, the results are for a more general audience the code could be hidden. In this way you can use code to generate tables, figures, and key outputs. For example, to include a table summarizing model results you could use something like:
library(knitr)
kable(summary(my_model)$coefficients, caption = "Model Coefficients")
- Add narrative text: Around your results or code chunks include text to explain your findings. For example: “The table above shows that age has a positive effect on income, while gender is associated with significant differences.”
- Incorporate visualizations: Use packages like
ggplot2to create graphs that illustrate your findings. - Render the document: Use the “Knit” button in RStudio to compile the document into your desired output format (e.g., HTML, PDF, or Word).
Example: creating a summary report using a dynamic document
Here’s an example of a minimal R Markdown file structure for a longitudinal data analysis report:
include_graphics("./fig/rmd_long.png")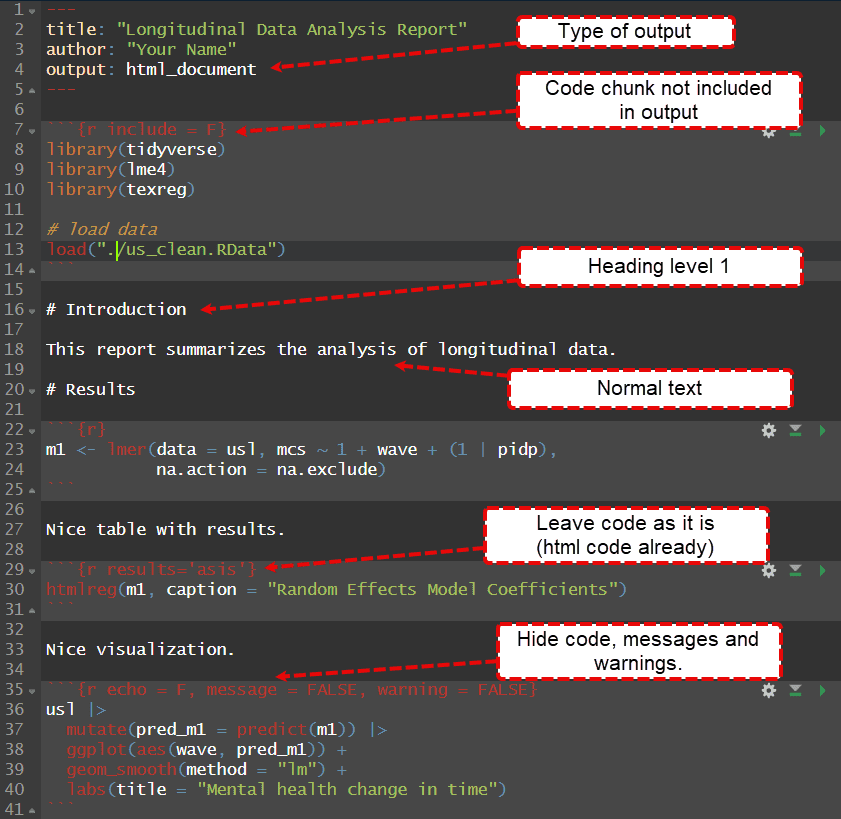
include_graphics("./fig/rmd_long_result.png")
Conclusions
By combining code, text, and visuals in one place, dynamic documents ensure that your results are always accurate, reproducible, and easy to share. Whether you’re presenting to colleagues or preparing a final report, this approach simplifies the process and enhances the clarity of your analysis.
Dynamic documents are an essential part of a reproducible workflow. They bridge the gap between data analysis and reporting, making it easier to communicate your findings in a reproducible way. You can lean more about how this fits into reproducible workflows and longitudinal data analysis here. You can also see how to include results from longitudinal data analysis here. More generally, you can learn about RMarkdown from this free online book.
Was the information useful?
Consider supporting the site: