Tag: visualization
Hands-On Introduction to Moderation Analysis

Learn how moderation analysis reveals when and for whom effects change in longitudinal data, with clear examples and practical modelling guidance. Read more
How to present results from longitudinal analysis


Learn how to present results from longitudinal data analysis using R Markdown, stargazer, texreg, and visualization tools like tidySEM and semPlot. Read more
Dynamic documents: a smarter way to share results
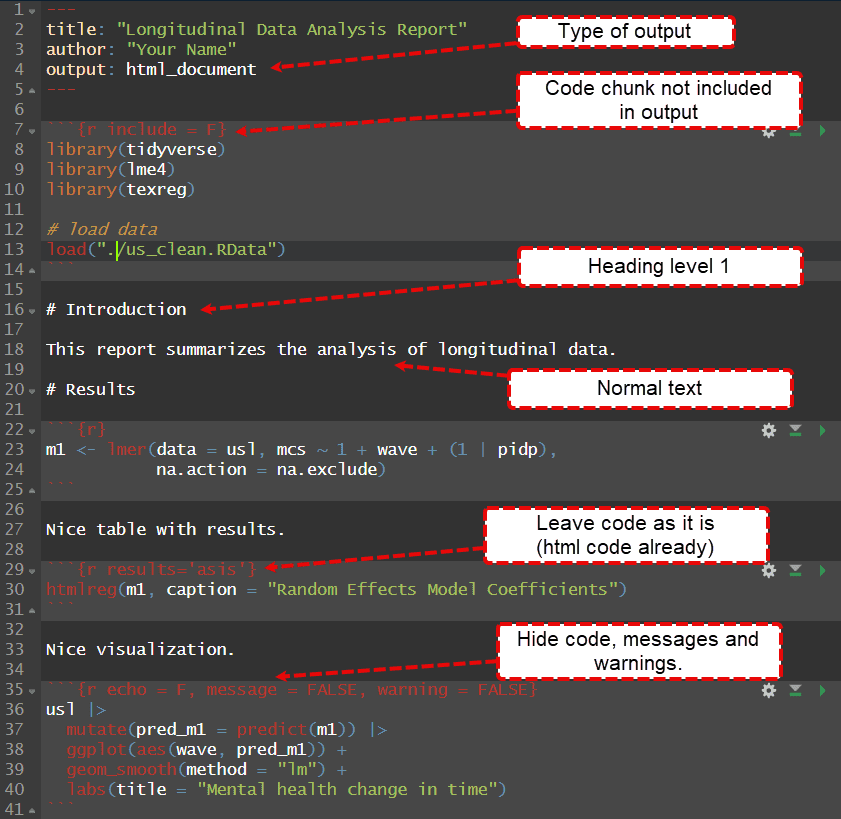

Learn how to use R Markdown to create a dynamic document for reproducible reports, automate updates, and seamlessly integrate code, text, and results in R. Read more
Mixture Latent Growth Models R: A Step-by-Step Guide


The blog post discusses Mixture Latent Growth Models (MLGM) that enhance traditional longitudinal models by identifying latent subgroups with distinct trajectories over time. It details the implementation of MLGM in R using the tidySEM package and compares results from using R and Mplus for improved understanding of individual and aggregate changes. Read more
How to estimate and interpret parallel Latent Growth Models (LGM) in R: a step-by-step guide


Learn how to estimate and interpret Parallel Latent Growth Models (LGM) in R and lavaan. This step-by-step guide explores modeling multiple trajectories, analyzing relationships over time, and visualizing results. Perfect for researchers in psychology, sociology, and public health using longitudinal data. Read more
Complete guide to visualizing longitudinal data in R


Unlock the secrets of longitudinal data in R with this complete guide. Master the art of insightful visualizations for impactful analysis. Read more
Estimating and visualizing multilevel models for change in R


Learn how to analyse longitudinal data using the multilevel model for change with R. Hands on example using real world data and syntax. Read more
Estimating non-linear change in time using the multilevel model for change


Learn how to model non-linear change in time using the multilevel model for change in R. Hands on tutorial with real data. Read more